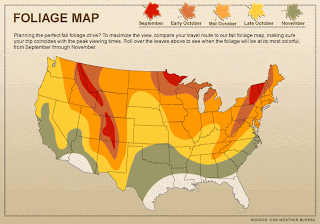
This is an Isarithmic map of the best times of year to see the changing colors of foliage across the United States. It seems mostly to follow suit with temperature norms. I.e. the colder the area the earlier you would want to go see the foliage. Its funny how florida isn't even represented by a color because there are almost no noticeable season changes there.
This is a Chloropleth map of all the documented shark attacks in Florida from 1882 to 2008. It outlines which areas (by county) are most dangerous. Pinellas County, where I lived for 9 years, is the only county on the Gulf of Mexico side in the 9-29 range.
This is a map of my typical bike ride from my apartment to work and back home on a typical day when I lived in Baton Rouge, Louisiana. There are markers for Brew-haha, my favorite coffee shop where I would stop on my way, and Raising Canes Chicken, Louisiana's version of Zaxby's where I would sometimes stop on my way home. The whole bike ride is right around 6 or 7 miles.


No comments:
Post a Comment